Do you need some help setting up Power BI for your organization? No problem!
Before Setting Up Power BI: Understanding What Power BI Is & How You Can Set It Up
Step 1. Choose which version of Power BI you’re going to use ☑️
Step 2. Set up Power BI by Uploading Your Data 🗃️
Step 3. Start Exploring Your Dataset 🔎
Step 4. Create Your First Report 📊
Setting Up Power BI Is Easy & Free – Try it Today!
If you’re looking for some more information on how you can get started using Power BI, this blog is for you. In it, we’ll show you our recipe for setting up Power BI in four easy steps.
Before Setting Up Power BI: Understanding What Power BI Is & How You Can Set It Up

Power BI is a Cloud-based business intelligence tool that pulls together all your unrelated data sources into one coherent and interactive reporting system. Extremely easy to use, Power BI helps you to create and collaborate on business intelligence reports and dashboards that are continuously updated via data streaming capabilities.
Setting up Power BI can be done in four simple steps: (1) choose which version you want to use, (2) upload your data, (3) start exploring your datasets, and (4) generate your first report. In the next few sections, we’ll walk you through these four steps in further detail, so read along for more information!
Step 1. Choose which version of Power BI you’re going to use ☑️
Setting up Power BI begins with determining which version you’re going to use.
Power BI has 3 versions: Power BI Desktop, Power BI Pro, and Power BI Premium. Below, we’ve prepared a table that briefly compares these versions:
.png?width=831&name=4%20Steps%20Setting%20Up%20Power%20BI%20(2).png)
Note: If your organization is already using an Office 365 Enterprise E5 license, you already have access to Power BI Pro. Not sure what version of Power BI to use, or want to learn how to purchase Power BI Pro or Power BI Premium? Contact our Power BI experts for a chat!
Step 2. Set up Power BI by Uploading Your Data 🗃️

Once you’ve set yourself up with the correct version you want to use, it’s time to upload your data!
From the welcome page that you see above, you can import or connect to your data through your files or databases that are saved on your computer. Click on the “Get” button under the data type that you’d like to upload. Then, choose from the various options that are available to you. Keep in mind, you can pull data from several sources, like local files, OneDrive files, files from your SharePoint site, and more.
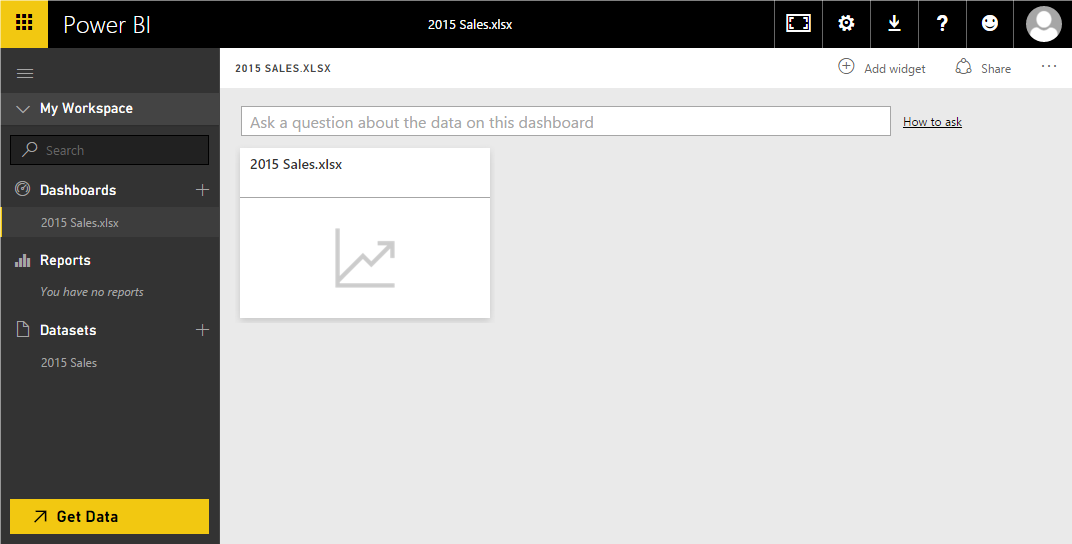
After you click on “Open”, you’ll see your file name has appeared as both a tab under “Dashboards” on the left-hand side of your screen (because Power BI will create a dashboard for you using the same name as your original file), or as an icon under the search bar. See below for an example:

Step 3. Start Exploring Your Dataset 🔎
Your experience with Power BI is all about gaining insights from your data. So, after you’ve gone ahead and uploaded the datasets that you want to use, it’s time to start exploring those datasets.
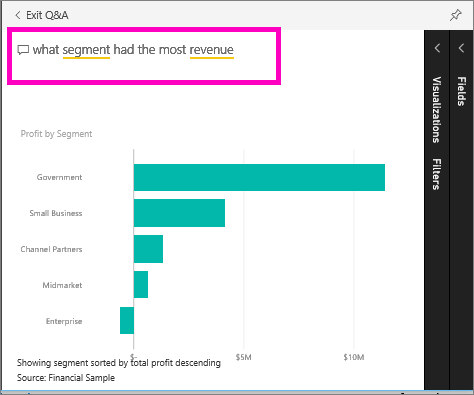
Power BI now has the ability to use what’s called natural-language queries, which help make it easier for you to get value from the data you’re looking to analyze. Natural-language queries don’t require special coding or syntax – just type a question, in plain English, into the search field, and let Power BI do the work!
Let’s say that the data you’ve uploaded shows sales information from the previous year. And, for the sake of this blog, let’s say that you want to create a report based on your top-selling products for 2017. You want to see what products did the best. So, in the search field, type in “show sales 2017 by product”.
When you hit ‘enter’, Power BI will generate a chart that shows you what content you want to see. Simple as that. If you want to keep that data so that you can refer to it often, click on the pin icon, which will pin that dataset to your dashboard so that you can see it in real time, anytime.

Step 4. Create Your First Report 📊
Creating a report can be done in a few easy steps. Below, we outline the process of how you can pull together your first report from start to finish:
1. Select an existing workspace or create a new one.
2. From the bottom of the left navigation pane, select Get data.
3. Select Files and navigate to the location where you saved the data you want to create the report from.
4. Select Import.
5. Once the dataset is imported, select View dataset.
6. Viewing a dataset actually opens the report editor. You'll see a blank canvas and the report editing tools. Need some help with the report editor? Take a tour here!
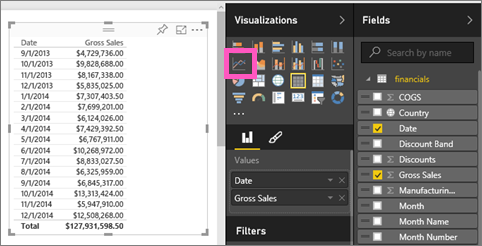
7. Decide what data you’d like the report to extrapolate. In the Fields pane, select the fields you want to work with. Add the various gauges using the Visualizations

8. Go ahead and save your report.
9. Continue exploring your data and adding visualizations. When you find especially interesting insights, pin them to a dashboard.
Setting Up Power BI Is Easy & Free – Try it Today!
Power BI helps you to see your data in a different way and gain insights from your numbers. In this blog, we’ve discussed four simple and fast steps to creating quick insights into your data that will help you to make better business decisions.
These four steps will help you get started with setting up Power BI. But there are also more robust features – from extensive modeling and real-time analytics to integration with other platforms, to customized development – that you can also take advantage of. That’s where ProServeIT’s team of Power BI experts comes in. We can walk you through these more advanced options and show you what Power BI can truly do for your organization.
Interested in getting started, or want to learn more about these advanced options? Give us a shout! Or see below a live demo of Power BI in action.
.png?width=889&name=Shipping%20%26%20Inventory%20Reporting%20-%20Power%20BI%20Case%20study%20(5).png) This blog’s content comes in part from a Microsoft ebook entitled, “Introducing Microsoft Power BI”. Click here to download the ebook.
This blog’s content comes in part from a Microsoft ebook entitled, “Introducing Microsoft Power BI”. Click here to download the ebook.
Tags:
Insights & AutomationSeptember 13, 2018


Comments